Pace Generates Most Sales Tax Revenue in Santa Rosa County

Posted on October 25, 2024 by Romi White

Chart shows the five-year average of sales tax collected per zip code(s). 
 
When it comes to sales tax revenue, Pace generates the most in Santa Rosa County with a 32% average over the five-year period from 2018-2022, per Florida Department of Revenue data.
 
Gulf Breeze generates the second highest with 28%, followed by Milton with 20%. Navarre generates the fourth highest with 18%, and Jay makes up 1%. 
 
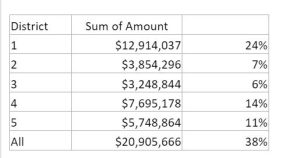
When it comes to spending related revenue, the following table shows the amount of COMPLETED projects per district. The most money expended to date has been for completed projects which benefit all the districts, totaling $20.9 million or 38%.
 
The remainder of the COMPLETED projects funded so far has been distributed as follows:
District 1 (Pace) 24% or ~$12.9 million
District 4 (Navarre) 14% or ~$7.7 million
District 5 (Gulf Breeze) 11% or ~$5.7 million
District 2 (Milton) $7% or $3.85 million
District 3 (Pace/North County) 6% or ~$3.25 million. 
Chart by Santa Rosa County Budget Department 
 
To date, LOST funding has been used in the south end of the county, specifically in District 4 (Navarre) and District 5 (Gulf Breeze), for funding improvements including but not limited to:

• $492,223 for new Navarre Beach restrooms (completed);
• $675,000 for soccer fields adjacent to Pensacola State College in Tiger Point (in progress);
• $3 for million Edgewood Drive resurfacing and sidewalk project (starting soon);
• $8+ million for Tom King Bayou Pedestrian Bridge and channel restoration projects (in progress);
• $2.25 million for road paving (mostly completed);
• $348,032 for Sunrise Drive Entrance Improvements (completed);
• $1.6 million for Settlers Colony drainage project (completed);
• $473,000 for South Santa Rosa County Health Department drainage project (completed);
• $684,311 for Venetian Way/Coronado Drive drainage project (completed);
• $500,000 for culvert upgrades on East Bay Boulevard (in progress).

For more detailed information on spending visit: Local Option Sales Tax Information
 
EDITOR’S NOTE: The revenues and expenditures cover different periods of time because the latest data available via FL-DOR is from 2018-2022